Skill Sprint · Growth Library
When You Study, Mix Words with Pictures
Dual Coding Theory Application
Read with the review status in mind
This migrated article contains evidence-like wording without a reviewed supporting source. The long-form article remains visible for readers, while those claims stay outside trusted recommendations until they are reviewed or rewritten.
Evidence: Evidence-like claims detected; source review pending.
Trust boundary: Visible does not mean reviewed. This article is not eligible for Brali's trusted recommendation feed or usable Agent Skills until its review state is promoted.
When You Study, Mix Words with Pictures — Brali
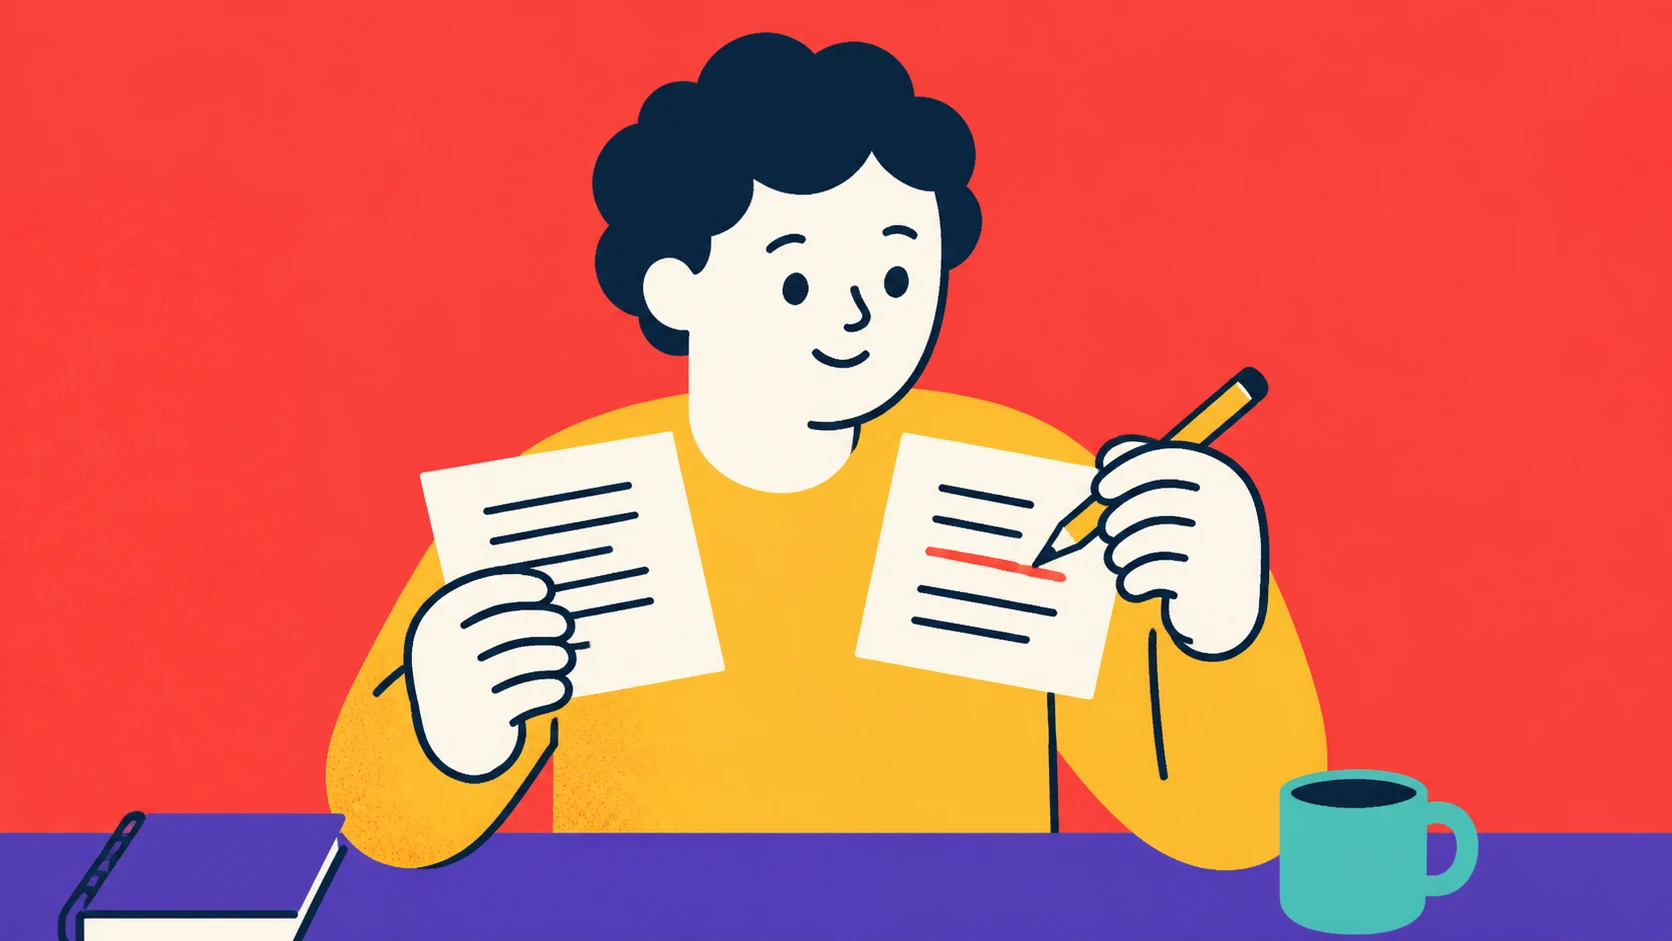
We sit with our notes and feel that low drag of half-understood ideas. The page fills with sentences, then longer sentences, then fatigue. We highlight. We tell ourselves we’ll “review later.” But later looks a lot like now. The sentences do not become lighter. When we add a sketch—a quick box-and-arrow, a tiny timeline, a doodled cell membrane—the page changes. We can point to the place where the idea lives. We can move our finger across a cause-and-effect. We can show someone else. The extra minute builds a handle.
Background snapshot: Dual coding started with Allan Paivio’s work in the 1970s: our brains encode verbal and visual information through partly separate channels that can support each other. In practice, many of us learn with words only (notes, lectures) and forget that a simple picture can double the encoding route. The trap is ornamentation—beautiful notes that take hours but add little memory. What shifts outcomes is relevance and speed: small, rough diagrams tightly tied to key ideas, made during or right after learning, and reviewed with retrieval. Research on multimedia learning suggests that combining words with relevant images improves transfer with a medium effect size (around d ≈ 0.5) when the images are essential, not decorative. And drawing itself can boost recall—studies show drawing improves later recall over writing by roughly 20–30 percentage points when time is held constant.
We will practice a compact, repeatable move: for each major idea we study, we add a 30–90 second visual. A sketch of steps, a labeled part, a spectrum, a cause-and-effect chain, a simple map. We do it rough, then we test it by explaining it once. This is not an art task. It is a thinking move.
We set up the context so that we can try it today, not someday. We make small decisions in front of the page, not debates in our heads about “learning styles.” If we add a picture and it slows us by 10% but returns 30% more recall, it is a good trade.
Scene 1: the pen pause
We are in a quiet corner after lunch. A mug with a finger-width of tea left. A notebook open to yesterday’s lecture on the Krebs cycle, or maybe it is Rousseau’s social contract, or the algorithm for breadth-first search. Our hand hovers over the line where we wrote a definition. We glance at the margin. Do we risk the messy sketch? We go: a circle of arrows for a cycle, four stick-figures for contract parties, a grid of nodes for the algorithm. The pen drags; we label 1, 2, 3. It takes 40 seconds. We mark one word bold. We close the notebook and try to explain out loud. We catch a gap. This is the point.
What we will do, exactly
- Target: in every study block (≥25 minutes), create 3–6 tiny “diagram-cards” that pair a short sentence with a sketch. Each card should take 1–2 minutes. Total added time: about 6–12 minutes per block.
- Shape: pick one of five quick schemas—sequence, parts, map, compare, cause. These cover most concepts.
- Test: after drawing, explain the diagram to yourself in one sentence. If we can’t, we are missing a step.
- Store and review: keep a running count in your own tracker. Tag cards by topic. Review 1–2 cards at the start of the next session.
We ease into it with one deliberate session today. We show ourselves that it fits.
Scene 2: the small decision that moves the day
We open our lecture slide deck and notes. We tell ourselves: three cards only. We set a 10-minute timer. We choose which concept first not by importance, but by friction—what feels slippery? We look at the section on “Osmosis vs. Diffusion” or “Opportunity Cost” or “Pointers vs. References.” Friction is our compass today. If a paragraph feels awkward to explain, it gets a sketch.
We set constraints: the card must fit on a quarter-page. The drawing must be black pen only. Labels must be two words or fewer. We set constraints to reduce fuss. If we want color later, we can use a highlighter as a signal, not a decoration. We are trying to walk a tightrope: enough visual to anchor the idea, not so much that it becomes a craft session.
Why mixing words and pictures works (in numbers we can feel)
- Two routes into memory: verbal and visual codes can cross-cue. If we store a fact in both, later one can trigger the other. This is not a myth of “learning styles”; it is about redundancy and structure.
- Drawing effect: when we draw a word or concept, we must select details, organize space, and execute strokes. That deep processing leads to better recall. Controlled studies report drawing improves free recall over writing by about 20–30 percentage points when time-on-task is the same.
- Multimedia principle: words + relevant images beat words alone for transfer tasks, with a median improvement roughly half a standard deviation. If our exam requires applying ideas, pictures help.
- Spacing and retrieval: visuals are easier to retrieve quickly (“that arrow that points left then right”), making spaced recall less aversive. This increases the number of retrieval reps we will actually do.
We do not need to memorize the papers to benefit. We do need to convert them into 90-second moves.
A quick schema menu (then we dissolve back into narrative)
- Sequence: boxes and arrows to show steps (e.g., Mitosis phases: Prophase → Metaphase → Anaphase → Telophase).
- Parts: a quick outline and labels (e.g., a neuron: dendrites, soma, axon, myelin).
- Map: a central concept with branches (e.g., Causes of WWI: M.A.I.N., with 2 sub-branches).
- Compare: a two-column table or Venn (e.g., diffusion vs. osmosis: medium, energy, gradient).
- Cause chain: a left-to-right chain with plus/minus signs (e.g., Interest rates ↑ → borrowing ↓ → demand ↓ → inflation ↓).
These are not rules; they are speed lanes. The moment we start, we often see which scheme fits. If two could work, pick the one we can draw in 20 seconds. We are optimizing for completion, not elegance.
Small trade-offs that matter
- Speed vs. clarity: a 20-second sketch often suffices. But if an extra 30 seconds makes a chain unambiguous, we take it. The metric isn’t time; it’s whether we can teach ourselves in one sentence after drawing.
- Neatness vs. usable: legible beats pretty. We cap ourselves at two handwriting sizes. We underline one word only if it supports retrieval (e.g., “rate-limiting step”).
- Digital vs. paper: tablets allow easy edits; paper reduces app friction. If we already type notes, adding a quick hand-drawn photo in the margin is better than no picture.
- During lecture vs. after: in fast lectures, we may mark “DRAW: enzyme lock-key” and do it after. During slow moments, we draw live. The bias should be to draw near the moment of learning because conversion cost is lower.
- Complexity: if the concept is huge (e.g., photosynthesis in detail), we target one slice (input/output). We are building a scaffold, not a cathedral.
A pivot, early and explicit
We assumed adding pictures would slow us too much in dense topics → observed that a single well-chosen diagram often replaced two paragraphs and cut our re-reading time by several minutes → changed to a rule: if a concept takes more than four lines to explain in words, force a diagram.
We felt relief after this pivot. The rule reduced the number of micro-decisions we had to make in-session. It also made visible a top-heavy note page: too many long blocks meant we were avoiding shape.
Scene 3: five subjects, five minutes
We test the schema across subjects. We pick a mixed study day:
-
Chemistry (10 minutes): Topic: Le Chatelier’s Principle. We draw a seesaw with reactants on one side, products on the other. We add a hand pushing down “concentration ↑” on reactants. Arrow indicates shift to products. We label “Q vs. K” as a tiny side box. We add +/− signs above temperature change for exothermic reactions. We explain out loud: “Increasing reactant concentration tilts the system; the equilibrium shifts to consume the addition.” We realize we forgot pressure; we add a quick “gas moles” icon: three balls vs. two balls. We time it: 2 minutes 40 seconds, 2 cards.
-
History (8 minutes): Topic: Marshall Plan. We draw a map outline of Western Europe with arrows from the US. We label “$13B (1948–1952)” and a note “industrial output ↑ ~35% (estimate; 1948–1951)”. We add a second card comparing this to the Molotov Plan with a Venn (aid conditionality, political alignment). Time: 3 minutes 10 seconds.
-
Computer Science (7 minutes): Topic: Big-O of search methods. We draw a list of n boxes and mark “linear: O(n)” with a scanning arrow. We draw a sorted list with a halving bracket to show binary search “O(log n)”. We add a tree for BFS vs. DFS labeling “queue” vs. “stack”. We circle “space” for BFS. Time: 3 minutes.
-
Language Learning (6 minutes): Topic: Spanish past tenses. We draw a timeline with Preterite as dots (completed actions) and Imperfect as a shaded band (ongoing). We add two sentences: “Ayer comí” (dot), “Cuando era niño…” (band). Time: 2 minutes 20 seconds.
-
Biology (9 minutes): Topic: Nephron function. We draw a loop with glomerulus, proximal tubule, loop of Henle, distal tubule, collecting duct. Arrows for water/ion movement. We use plus/minus for ADH effect. We stop at 3 minutes.
We step back. We made 9 cards in 16–20 minutes. They are ugly. They also compress pages of words. When we close our eyes, we can see the shapes. When we look at the cards, we can say one sentence for each. This is the feeling we are after: a handle.
The failure mode: pretty notes versus doing the reps
We have seen the Instagram trap: notes that look like a poster. Hours vanish into color coding. The return on learning per minute drops. If we catch ourselves reaching for a second color pen to shade something that is already clear, we stop. We ask: Will this added minute change how I explain it later? If not, we move on. We can allow ourselves one highlight per card, maximum two words. That is enough to cue retrieval.
The second failure mode: irrelevant images
Clip-art neurons, scenic maps, emoji metaphors. If a picture does not remove a sentence or make a causal link visible, it is decoration. We do not shame ourselves; we simply prune. A rule we use: if we can label the picture with a verb (transfer, inhibit, undergo, convert), it is likely relevant. If the only label is a noun (flower, cloud) and it adds no structure, we question it.
Tools and setups that reduce friction
- Paper setup: one A4 or US letter sheet per study block, folded in half to create four panels. Each panel holds 2–3 cards. One black pen. One highlighter (optional). Phone camera for capture (we can take 6–8 photos in under a minute).
- Digital setup: tablet with a simple drawing app; we create one canvas with four quadrants. Or we draw on scrap paper and import to a note app. On a laptop, we can use a basic diagram tool and stay with straight lines and text boxes.
- Storage: your tracker “Diagram Cards” collection. We add tags: subject, topic, date. We log count and minutes.
Optional nudgeon “Diagram Count” quick-log. After each session, tap + for each card and type a 1-sentence caption. It takes under 20 seconds and keeps the streak visible.
We are not building a vault; we are building a ladder we actually climb.
Practice sketch: one study block today
We aim for 25–40 minutes. The goal is to make the smallest version of the habit stick.
- Minute 0–2: decide on topic and open materials. If we have readings or lectures queued, pick the section that feels foggy.
- Minute 2–5: skim for 3 concepts. Mark them with a small dot in the margin. Do not start writing text yet.
- Minute 5–15: for each concept, draw one diagram-card. Use the schema that fits. Write a single caption below (≤12 words).
- Minute 15–20: close the materials. For each card, explain it out loud in one sentence. If we stumble, add one label or rearrange an arrow.
- Minute 20–23: photograph or save the cards. Add tags. Log counts.
- Minute 23–25: plan the next mini-review: pick two cards to explain tomorrow.
We will feel clumsy on the first two. We set an expectation: 60% confidence is fine. We are rehearsing a move, not finishing a product.
An explicit constraint: one-sentence caption
Words and pictures together win because they clear the ambiguity that either alone can have. We enforce a hard cap: the caption must fit in one sentence, 12 words or fewer. This forces us to choose verbs. “Enzyme lowers activation energy by stabilizing transition state” beats “Enzymes: active site, substrate, product” because it carries mechanism.
People and contexts that need tweaks
- If we “can’t draw”: good. Stick figures and arrows are enough. Our aim is spatial layout, not art. We can pre-learn 10 icons (box, arrow, wavy line, timeline, two circles, triangle, plus/minus, droplet, tree, bracket). That’s our toolkit, not a style guide.
- If we have dysgraphia or motor challenges: use stamps and stickers, or drag-and-drop shapes in a digital tool. The cognitive work is choosing and arranging, not freehand drawing. We can speak the caption and use speech-to-text.
- If we have visual impairments: we can invert the habit: record a 20-second audio describing a spatial relation (“left-toright sequence”) and pair it with a printed, tactile graphic or an audio “verbal diagram” structure. We can also use ASCII diagrams with text-only tools.
- If the subject is abstract math: draw the simplest case. For limits, draw a curve approaching a line with arrows. For group theory, draw a Cayley table with a 2×2 block. For proofs, draw the flow of implications as a sequence of arrows and callouts.
- If the subject is literature: map relationships, motives, or themes. A triangle between characters with labels “betrayal,” “dependence,” “loyalty.” A timeline of two plots in parallel.
- If we’re under timed exam prep: we cap ourselves to 90 seconds per diagram. Use a timer. We select only the highest-yield concepts (formulas, processes, comparatives).
Handling common objections
- “I’m already short on time.” If we spend 8 minutes today to create four diagram-cards, and tomorrow’s review drops from 25 minutes to 15 because we can retrieve more quickly, we net 2 minutes back immediately and likely more later. We are front-loading structure.
- “Pictures don’t work for me.” If we mean “I don’t enjoy drawing,” that is different. If we mean “I recall words better,” we test this for one week. If our quiz scores or retrieval speed do not improve at all, we can adjust—we keep captions and drop sketches for topics where a schema adds no clarity.
- “My teacher doesn’t allow notes with pictures in exams.” We are not using pictures on the exam; we are using them to build mental models that are faster to recall and apply. Visual rehearsal helps even for text-only tasks.
- “It feels childish.” So does practicing scales. We can choose that feeling or choose the results. If it helps: use straight lines and labels only. Those are diagrams, not doodles.
A tiny standard for what “good enough” looks like
- If someone else can make one correct inference from our card without us explaining it, it is good enough.
- If we can reproduce the shape from memory in under 15 seconds, it is good enough.
- If our one-sentence caption contains a verb that implies mechanism, it is good enough.
We don’t chase perfect. Perfect is the enemy of throughput. Throughput is the friend of recall.
The retrieval hook: how we use the card tomorrow
We open to the last two cards we made. We cover the caption with a sticky note or with our hand. We look at the picture and speak the sentence. Then we cover the picture and try to reconstruct the key lines from the caption. Two passes, 60–90 seconds each. We log the count. We exit. This tiny retrieval rep boosts memory far more than re-reading our notes. And because the picture reduces the friction, we actually do the rep. The best method is the one we repeat.
Sample Day Tally (how to hit a target today)
Let’s say our target is 6 diagram-cards and 20 minutes of active study.
- Morning commute (bus, 6 minutes): 2 cards on “Supply vs. Demand shifts” (two axes, two shift arrows). 6 minutes.
- Lunch break (10 minutes): 3 cards on “Neural action potential” (resting, depolarization, repolarization) and “Refractory period” (shaded band). 10 minutes.
- Evening (7 minutes): 1 card on “Bayes’ theorem” (two boxes, prior → likelihood → posterior) with a small numeric example (counts: 10/100). 7 minutes.
Totals: Cards = 6. Active time = 23 minutes. We log: count 6; minutes 23. We add one highlight: the Bayes numeric example improved our clarity. Tomorrow, we pick two cards to explain in under 2 minutes.
When pictures mislead: guardrails
- Split attention: If we place labels far from the parts they label, we force long saccades and cognitive load increases. Keep labels close. Use tiny arrows if needed.
- Seductive details: An interesting but irrelevant icon can hijack retrieval. We avoid humor that doesn’t teach the concept itself. Our rule: if it doesn’t help on a test, it probably doesn’t belong.
- Spatial rigor: If direction or scale matters, we pick a convention and stick to it. For chemical equilibrium, left-to-right for reactants-to-products. For timelines, left-to-right for time increasing. We avoid flipping axes across cards.
- Overcrowding: If a card has more than 5 labels, split it. Our brain chunks in 3–5 elements well. More becomes re-reading.
- Copy-paste trap: Importing a complex textbook figure can feel like progress. If we do import, we trace a simplified version and add our own labels. Ownership produces processing.
Our one explicit pivot (again, to show our work)
We assumed that adding color would make diagrams more memorable → observed that we slowed down, focused on aesthetics, and our retrieval benefit didn’t increase in a measurable way over monochrome for simple cards → changed to using a single highlighter solely for signaling “start here” or “rate-limiting step,” capped at one highlight per card.
We carry this forward. The pivot freed us to move faster and gave a visible cue that had meaning.
A small repertoire of micro-moves to learn, then reuse
- Bracketing: use a curly brace to group two sub-steps under one label. Visual grouping reduces captions by a third.
- Signposting: a star on the step where students often go wrong, with a 2-word note (“watch sign”).
- Overlay: draw the same diagram twice, second time with one extra arrow in a different pen or with dashed lines. It shows change.
- Mirror: for compare cards, mirror the layout so that differences are aligned vertically. Faster scanning.
- Count cues: tiny numbers (1, 2, 3) near arrows anchor sequence without words.
We practice these once; they keep paying rent.
Edge cases: languages with different scripts, and STEM labs
- Languages: for characters (e.g., Mandarin), we can draw a character with arrows showing stroke order (numbers 1–6). Add a mini “radical → meaning” link. For grammar, use timelines and boxes. For vocabulary, draw the simplest icon that cues the meaning, then write the word and one collocation.
- Labs: when we set up equipment (pipette, centrifuge), we sketch the setup with labels “volumes: 250 µL,” “speed: 12,000 g,” “time: 2 min.” We check off during the lab. Later, that sketch plus numbers is the fastest lab notebook page to reconstruct. The card becomes evidence and memory.
A time budget, expressed plainly
If our sessions are typically 50 minutes, we aim to spend 10–15 of those on diagram-cards. That’s 20–30%. If we do less, the pictures won’t accumulate; if we do more, we may crowd out problem solving. We set a soft max: 8 cards per session. We would rather make 4 solid cards and do 15 minutes of retrieval-practice problems than make 12 cards and do none.
If we do three sessions per week, and each has 6 cards, after two weeks we have 36 cards. Reviewing 36 cards at 15 seconds each is 9 minutes. We can loop that on a Saturday morning in one coffee.
Numbers to watch that predict persistence
- Average minutes per card: target 60–90 seconds. If it drifts above 120, we are probably over-detailing.
- Cards per session: target 4–8. If we hit 0–2 frequently, friction is too high; we simplify tools.
- “Explain in one sentence” pass rate: target ≥70% the next day. If it’s lower, the captions might be too vague; we add verbs.
What about group study?
We can run a 10-minute “pair and draw” at the start of a group session. Each person brings two cards. We exchange and explain each in one sentence. Then we each recreate the other person’s diagram from memory in 30 seconds. Three rounds: 9 minutes. The group will find holes in the cards, fast. We take notes on which schema worked best for the same concept. The competitive energy helps.
A five-minute path for busy days
We timebox it hard. Choose one concept we encountered today. Set a 3-minute timer. Draw one diagram-card using the “compare” or “sequence” schema. Caption it in 12 words or fewer. Then, for 2 minutes, explain it once to ourselves and once to a rubber duck or an imaginary classmate. Photograph. Log “1 card, 5 minutes.” Done. No expansion allowed.
If we do this 4 days in a row, we have 4 anchors and a streak we can point to. The streak itself becomes a nudge.
How to blend with other evidence-based study practices
- Interleaving: we can do two cards from Topic A, then one from Topic B. This mix produces a small desirable difficulty and better discrimination. The pictures make the switch less jarring.
- Spacing: we review two cards tomorrow, two in three days, two in one week. If we log in your own tracker, the review reminders align with our check-ins.
- Retrieval: we cover the caption and speak the explanation. We cover the picture and sketch the skeleton. No peeking for 10 seconds. This is the labor that wires memory.
- Elaboration: after we draw, we answer one “why” question in the caption: “because…” This deepens structure.
If we have 45 minutes, we can spend 15 on diagrams, 20 on retrieval practice, and 10 on a problem set. The diagrams lower the friction of retrieval and show gaps that inform the problem set.
When the topic resists a picture
Some ideas feel non-spatial: “justice,” “democracy,” “anxiety.” We can still map mechanism or relationships. For “justice,” we could draw scales with two labeled arguments, then a box for “principle applied.” For “anxiety,” we could draw a trigger → thought → body response → behavior loop. If we can define inputs and outputs, we can draw a chain. If we still cannot draw it, we can write a single cause-effect sentence with arrows (ASCII diagram): trigger -> appraisal -> response. That counts.
A few short lived micro-scenes from our notes desk
-
We are halfway through a physics problem. We have variables splattered across the page. We stop and draw the free-body diagram: a box, weight vector down, normal up, friction left. We label magnitudes in N. The equation that follows suddenly fits. The picture doesn’t solve it; it clears the room for the solution to walk in.
-
We read a philosophy paragraph three times and still feel fog. We draw a triangle: Author A’s thesis, Author B’s critique, Author C’s synthesis. We write the arrow notes: A -> B (claims X is Y), B -> C (reframes premise). The next sentence we would write becomes unnecessary. The picture already said it.
-
We are revising biology at 23:00. Our eyes are done. We flip to our diagram-cards. The kidney loop shows itself. We speak it in one sentence. Relief: no page turns tonight.
Memory cares about structure and retrieval more than about our feeling of familiarity. The pictures add structure. The captions and one-sentence explanations add retrieval.
Metrics and small experiments
We can run a 7-day test. We pick two topics of similar difficulty. For Topic A (control), we do our usual notes. For Topic B (intervention), we add 4–6 diagram-cards per session. After 7 days, we do a 10-question self-quiz on each topic. We track:
- Time to complete quiz (minutes).
- Score (out of 10).
- Confidence for each answer (1–5).
If Topic B shows faster time or higher score or narrower gap between confidence and accuracy, we keep the habit. If not, we inspect: were the diagrams relevant? Were captions mechanistic? Did we review at least twice?
We can also measure retrieval speed in day-to-day review: time to explain three cards. If that time drops across the week while the explanations stay accurate, we know we are building speed.
A note on evidence without hubris
We lean on decades of cognitive science: dual coding, multimedia learning, the drawing effect, retrieval practice. The exact effect sizes depend on tasks and learners. We do not promise miracles. A little better recall on many days is enough to change grades and reduce stress. If we can remember 2 more items out of 10 under exam conditions because our mind has a spatial hook, that is a win. The compounding arrives from repetition.
Smoothing the pipeline: from lecture to card to review
We create three simple waypoints:
- In-lecture: mark “DRAW” next to any concept that the instructor gestures in space for (hands showing a cycle, a map on the slide, a timeline, a flow). This is a signal: spatialize it later.
- Post-lecture (same day): make the actual cards for those marks. If time is tight, do 2 now, 2 tomorrow.
- Pre-next lecture: review two cards for that course before it starts. The act primes the next session.
We can do this in 5-minute pockets. The key is proximity: the longer we wait, the higher the effort to reconstruct the picture becomes, and the lower the chance we’ll do it.
We check the cost side honestly
- Time investment: 1–2 minutes per card. If we make 6 cards per session, we spend ~8–12 minutes. Across 3 weekly sessions: ~30 minutes. This is the cost. We offset by faster reviews and fewer re-reads. If we do not see net time savings by week 2, we re-scope the number of cards to 3–4 per session and focus on the highest-yield concepts only.
- Material cost: a pen and paper, or a tablet. We do not need special markers. If we crave color, we delay buying supplies until we have a 10-day streak.
- Cognitive load: the first week feels effortful; we are learning a new move. We plan small. We celebrate a low bar: 1 card per day on bad days.
Common slips and how we course-correct
- We make zero cards for a week. We restart with the 5-minute path, one card per day.
- Our captions are vague (“important,” “change”). We rewrite with verbs and specifics (“oxidizes,” “decreases by 10%”).
- We overcomplicate. We use the schema menu: sequence, parts, map, compare, cause. We pick one and move.
- We forget to review. We add a Brali reminder to review 2 cards at the start of any study session. We tack it to our existing habit (open laptop → review 2 cards → then proceed).
- We feel no effect. We run the 7-day test with a quiz. If no effect, we check if our cards were too decorative, or if we skipped the explain-out-loud step.
A quick set of worked micro-examples (in one paragraph each)
-
Economics: “Elasticity of demand.” Draw price on y-axis, quantity on x-axis. Two demand curves: steep (inelastic), shallow (elastic). Mark ΔQ for the same ΔP. Caption: “Flatter curve means quantity responds more to price changes.” Then add one real number: if P ↑ 10% and Q ↓ 5%, elasticity = 0.5 (inelastic). One picture plus one number locks it in.
-
Anatomy: “Sarcromere contraction.” Draw two lines sliding. Label actin, myosin, Z-lines. Arrow shows sliding filament toward center. Caption: “Myosin pulls actin; ATP breaks crossbridge to reset.” The verb “pulls” and “breaks” matter more than the shading.
-
Statistics: “Confidence interval vs. prediction interval.” Draw a mean with a narrow band around it and a wider band for single outcome. Caption: “CI for mean is narrow; PI for individual is wider.” If we can say this in 10 words without the picture, we might not have needed the picture. But with the picture, we can retrieve it faster.
-
Literature: “Foreshadowing in Chapter 3.” Draw a small trail of three breadcrumbs leading to a door. Label breadcrumb 1 (broken locket), 2 (storm warning), 3 (candle blown). Caption: “Early hints set up the reveal; reader tension builds.” Is it childish? Perhaps. Is it memorable? Likely.
-
Programming: “Pointer vs. reference (C++).” Draw two boxes: one with an address, one alias tag. Arrow from pointer to address; reference points directly to object. Caption: “Pointer stores address, can reassign; reference is alias, cannot null.” A small difference that exams test.
How we add numbers without making math homework
We add at most one number per card. This makes it concrete and testable. Examples: “$13B” for Marshall Plan, “O(log n)” for binary search, “20 mV” change in membrane potential, “∆G < 0” for spontaneous. Numbers anchor memory. If we add too many, we drown in detail.
Workload integration: aligning with our week
We pencil this rhythm:
- Monday/Wednesday/Friday: during main study block, 6 cards per session (3 topics, 2 each).
- Tuesday/Thursday: review 4 cards in 3 minutes before class.
- Saturday: 10-minute skim of the week’s 18 cards; pick 3 to rewrite because they didn’t pass the explain test.
We measure: minutes, count, pass rate. By week 3, we will see graphs we can point to. The visual cue in our log becomes an emotional cue. We feel progress.
We allow emotion, lightly
The first time we nail a concept that has nagged us for weeks, there is relief. Not fireworks—just a shoulder drop. The first time we catch ourselves in an exam re-seeing our own sketch, we feel grateful to past-us. On nights when nothing sticks, we can feel annoyed. We can also pick one card, draw one arrow, and salvage the day. This hack has a low floor and a high ceiling; we exploit that.
Mini failure scene and recovery
We tried to illustrate all of oxidative phosphorylation on one card. It turned into a spaghetti of arrows. The next day, we couldn’t explain it. We felt foolish. We split it: Card 1: proton gradient creation (complex I–IV). Card 2: ATP synthase function (rotor, proton flow). Card 3: inhibitor effects (oligomycin blocks ATP synthase). Three cards, 6 minutes, clear. We logged the pivot and moved on.
Misconception check
- “Learning styles mean I’m a visual learner; pictures are my best method.” Research does not support the idea that teaching to a preferred style improves outcomes. Pictures help because they complement words and force structure, not because of a label on our identity.
- “Any picture helps.” No. Only relevant pictures that reduce text or clarify mechanism. Decorative images can hurt by consuming attention.
- “This is only for STEM.” No. Any domain with relationships benefits. We have used it in philosophy, law (case flowcharts), languages, history (timelines), and art history (composition diagrams).
Risks and limits
- Overconfidence: pictures can create the illusion of understanding. We must test: explain in one sentence without looking. If we can’t, the picture is not yet knowledge.
- Time sink: if we drift into design, we lose the benefit. We set hard time limits per card and track minutes.
- Access: if our device is needed, keep a pen-and-index-card backup. Or use a single sheet we carry.
How we embed this in your own tracker
We create a “Diagram Cards” practice in your own tracker with two fields: count (cards created) and minutes. Each study block, we tap + for each card. We add a one-line journal note for any card that changed our understanding. For review, we set a daily quick check: “Explain two cards in <2 minutes.” your tracker serves as scaffolding, not the practice. The practice is the pen on paper or the hand on the tablet. But the logs keep us honest and the check-ins keep us reflective.
Check-in Block
Daily (3 Qs)
- Did we create at least 2 diagram-cards today? (Yes/No + count)
- Which card felt most “click”—what was the one-sentence explanation?
- Where did we stumble for >10 seconds—what adjustment will we try next card?
Weekly (3 Qs)
- On how many days (0–7) did we make at least one diagram-card?
- Did our “explain in one sentence” pass rate improve (down/same/up) compared to last week?
- Which schema (sequence, parts, map, compare, cause) did we use most, and where will we diversify next week?
Metrics
- Count: number of diagram-cards created (per day, per week).
- Minutes: time spent creating diagram-cards (per day).
We fill these in inside Brali or on paper. The answers improve the behavior next week more than they set a score today. We are not chasing a badge; we are building a muscle.
A small cadence to sustain the habit
- Before study: 2 minutes to review two cards (one from last 48 hours, one older).
- During study: 10 minutes to create 4–6 cards.
- After study: 1 minute to log count and minutes; 30 seconds to pick two cards to review tomorrow.
We can hold this even during busy weeks. On exam weeks, we may scale down creation and scale up review. On break weeks, we do one “best of” redraw of a messy card to fix it for the next term.
An example log (one day)
- 08:15–08:21: Created 3 cards (Chem: equilibrium shifts; Econ: elasticity). Minutes: 6.
- 12:40–12:48: Created 2 cards (Stats: confidence vs. prediction interval; Bayes). Minutes: 8.
- 20:10–20:14: Reviewed 3 cards (explained all in <2 minutes). Minutes: 4.
Total cards: 5. Total minutes: 18. Notes: The Bayes card needed numbers to click; added 10/100, 2/10.
Alternative path if we’re overwhelmed
We do not draw. We instead annotate one textbook figure by adding four labels and a one-sentence caption, then cover labels and retrieve once. This is a 3–5 minute move that still engages dual coding: we bind words (labels, caption) to a picture we did not draw. On days when bandwidth is zero, this preserves the habit thread.
Closing the loop
We began with a short reluctance: won’t this slow us down? After a week of small cards and one-sentence tests, we often find the opposite. The time we spent laying out a shape pays back every time we reach for the idea. The picture makes the place in memory. The caption ties it down. The check-ins keep us honest. We do not need to believe in a grand theory to see a local improvement. We only need to try it today and measure.
Hack Card
- Hack №: 53
- Hack name: When You Study, Mix Words with Pictures
- Category: Skill Sprint
- Why this helps: Pairing a quick sketch with a short sentence creates two memory routes and forces structure, improving recall and transfer with minimal extra time.
- Evidence (short): Drawing boosts later recall over writing by roughly 20–30 percentage points in controlled tasks; relevant words+images show about a half–SD gain in transfer in multimedia learning research.
- Check‑ins (paper / your tracker): Daily—Did we make ≥2 diagram-cards? Which card clicked? Where did we stumble; what to adjust? Weekly—How many days did we practice? Did pass-rate improve? Which schema dominated?
- Metric(s): Diagram-cards (count), Minutes spent (per day).
- First micro‑task (≤10 minutes): Pick one concept you learned today; draw a 4-box sequence or a 2-column compare diagram with a 12‑word caption, then explain it once out loud; photograph and log 1 card.
- Open in your own tracker (tasks • check‑ins • journal)
Questions to consider
How do I track my progress with this habit?
Use the check-in method described above and record the result somewhere you will actually review, so progress stays visible over time.
What if I miss a day or forget to do this habit?
Don't worry! Life OS habits are designed to be flexible. Just get back on track the next day without judgment.
How long does it take to form this habit?
There is no fixed number of days for a habit to become automatic. Keep the context consistent, notice whether the action is getting easier to repeat, and review the practice over time instead of treating a countdown as a success criterion. Focus on consistency rather than perfection to build momentum.
Article versions
Brali keeps substantive article history visible. Later reviews may refresh wording, sources, examples, or boundaries without silently replacing the record.
- Version 2025-10-06: first recorded publication in the migrated Brali corpus.
Canonical source record · Evidence state: pending-review.
Maintenance record
Review history
Current status: Active. Published without a later explicit lifecycle conclusion.
No explicit review event has been recorded yet. The hack remains published from its source content and can be challenged or reviewed.
Browse the review ledger · Challenge or update this hack
Implementation observations can trigger a review, but they cannot change an evidence conclusion by themselves. Commercial relationships do not control review status or outcomes.